Before charts. Before alerts. Before any decision about whether today deserves your time and focus, this is where you start.
Every trader has sat down at their screen, opened a chart, and spent the first hour trying to figure out what kind of day they're in. Is the market moving cleanly or just making noise? Is this a day to engage or a day to wait? Most platforms make you answer that question the hard way, by watching, guessing, and often finding out too late.
The Live Session Report answers it before you've committed a single minute of focused attention.
What It Tells You Before Anything Else
One question drives everything on this page: what kind of trading day is this, right now? Not based on one symbol. Not in hindsight. Live, across every tracked market, as the session develops.
It loads paused. Nothing streams until you click Play, giving you a moment to see where things stand before you start watching them move. You can pause at any time to study what's in front of you without the numbers shifting underneath you. When you resume, it picks up from the present moment.
What You're Actually Looking At
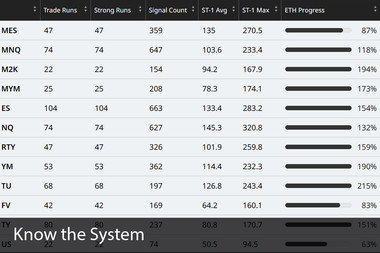
The report is a table. Each row is a symbol. Each column answers a specific question about how that symbol's session is developing.
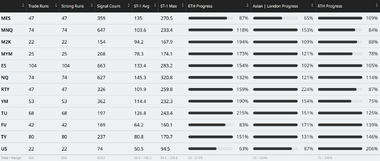
Trade Runs tell you whether the market is actually going somewhere. A single signal firing isn't a Trade Run. A Trade Run means signals connected into sustained, developing movement. The market didn't just twitch. It committed.
Strong Runs tell you whether that movement had real conviction behind it, specifically whether ST-1 reached 18% or higher during the run. This is the difference between the market attempting to move and the market actually moving with participation behind it.
Signal Count alongside Trade Runs tells you the quality of the day at a glance. High signal count with few Trade Runs means a noisy session, lots of activity with little follow-through. Fewer signals with more Trade Runs means the opposite: cleaner movement, better opportunity, a higher quality day to be engaged.
ST-1 Avg shows the average strength of the session so far. A low reading means low energy. A rising reading as the day develops means conviction is building, and sometimes that's the signal to keep waiting rather than force something early.
ST-1 Max shows the strongest single moment the session has produced. A high Max paired with a low Avg means one spike occurred without broad support. A high Avg and a high Max together means the session has had sustained, real structure — not a single lucky push.
Progress Window shows where each symbol is in its typical development cycle. There is one for each trading session of the day. It's not a clock. It reflects pace and development relative to that symbol's normal behavior. It can exceed 100%, which means the session is running stronger or faster than usual, and that's information worth having. Where a symbol finishes in the Progress Window often says as much about the day as where it started.
How It Changes the Way You Work
Every column header is interactive. Clicking it re-sorts the table instantly, putting the symbols that matter most to you at the top. Sort by Strong Runs to see where real structure has formed. Sort by ST-1 Avg to find where strength has been consistent. The table reorders itself automatically as the session evolves, so the movement you see isn't just data. It's the session telling you which markets are worth your attention right now.
Each symbol is also measured against its own historical behavior, not against other markets. That's what allows Treasury instruments, micro indexes, and E-minis to sit in the same table without one category drowning out the others.
What This Actually Does for You
The Live Session Report doesn't tell you whether to trade. It tells you whether the market is offering the kind of conditions that make trading worth your time, before you've spent an hour finding that out the hard way.
Before you open a single chart, you already know whether signals are building or failing, whether strength is isolated or sustained, whether the day is worth your full engagement or your patience.
It doesn't remove your judgment. It makes sure your judgment is pointed at the right things from the moment you sit down.