Every signal service will tell you their system works. Stronger Trades shows you.
The Trade Study is an archive of real trades the system identified. Not hypothetical setups, not simulations run after the fact, but actual signals generated in real time, documented as they happened. The full picture is there for every trade: what the system saw, what the indicators showed, how the trade developed, and what the outcome was.
That kind of transparency is rare. And it changes your relationship with the platform before you've even placed your first trade.
See It to Believe It
Most traders come to a new platform with a reasonable question: does this actually work? The Trade Study answers that directly. You can go through recent trades one by one, see exactly what conditions produced each signal, watch how the indicators lined up, and evaluate the results for yourself. Nobody is asking you to take their word for it.
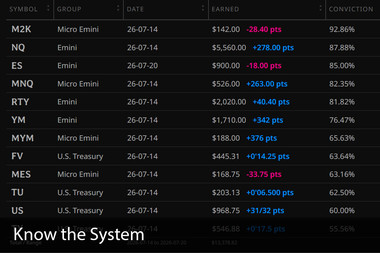
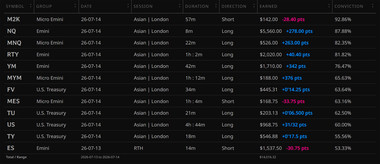
The Study shows you the most recent trades, refreshed every trading day. Symbol, direction, session, duration, how much was earned per contract, and conviction percentage. It's the live record, right there, before you've clicked on a single trade.
The Fastest Way to Develop Your Eye
There's a skill that separates traders who react to what already happened from traders who recognize what's developing before it resolves. It's pattern recognition, and there's no faster way to build it than studying real examples with all the data visible.
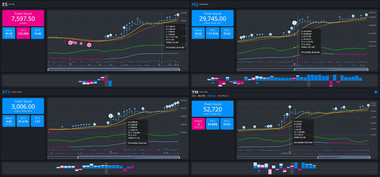
Every trade in the Study gives you the same view a trader had in real time when that signal arrived. The signal panel shows entry price, direction, and strength. The chart shows the price action that produced it and how the trade unfolded. The Trend Bars show the pattern of the move as it developed. Each study also opens all four related markets at once, so you see the trade in context, not in isolation.
You're not reading a recap. You're experiencing the trade as it happened.
The more trades you work through, the faster your eye develops. You start to recognize what a strong setup looks like before it resolves, and when those same conditions start forming on the live dashboard, you recognize them. That recognition is worth more than any alert the system can send you.
Performance Reports
For a broader view, the Performance Report at study.strongertrades.com/performance tracks three specific measures across every covered instrument, week, month, and year-to-date:
- Strong Signals — the percentage of issued signals where ST-1 reached 18% or higher during the trade run. This is the measure of how often the system produced high-conviction directional movement rather than noise.
- Trade Runs — the number of signal sequences generated per session, along with session averages and highs. This tells you how active and structured the system has been across time.
- ST-1 Values — the actual ST-1 readings produced during those runs. ST-1 is unbounded; higher values reflect stronger signal momentum. The report tracks averages and peaks across every timeframe.
The Trade Study builds your eye trade by trade. The Performance Report shows you the system's track record in measurable terms. Together they give you both the detail and the perspective, everything you need to engage with the platform from a position of informed confidence rather than hope.
Where to Start
If you're new, start with recent trades on the instruments you plan to trade. Don't just check whether they worked. Look at what the indicators were doing, how the signals developed, where the notable moments appeared on the chart. Build the vocabulary of what a good setup looks like in this system.
The live dashboard will start making sense faster than you'd expect. And when it does, you'll know exactly why.