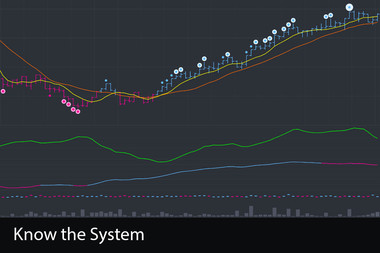
Every decision on the platform starts with a signal. Here's what the system is actually telling you, and how to read it.
A signal by itself is just a notification. What turns it into something you can act on with confidence is understanding what the system is telling you, and why it matters at that exact moment.
That's what this article is for.
The Language of the Platform
Before anything else, there's a color system worth knowing because it runs through everything. Cyan means long. Magenta means short. Once that's in your head, the dashboard speaks to you instantly. No translating, no second-guessing which direction a signal is pointing.
Entry Signals — The Start of the Conversation
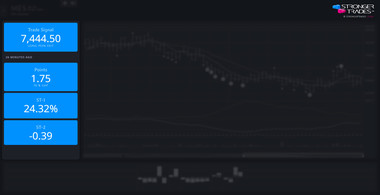
An Entry signal marks the price where the system has identified a potential trade opportunity. It includes a built-in price gap, a cushion between the signal price and your actual entry. That gap is there to protect you from one of the most common and avoidable ways traders lose money: getting filled and immediately watching the trade move against you.
But here's the distinction that changes how you use them. An Entry signal is the start of the conversation, not the end of it. It's the system telling you something is developing, not necessarily that it's time to act. The traders who get the most out of Stronger Trades use Entry signals as an alert to pay attention, then wait for the other indicators to confirm before committing.
When everything lines up, conviction is highest. The Entry signal opens the door. The indicators tell you whether to walk through it.
Peak Exit Signals — Knowing When to Leave
Just as the system tells you when something is developing, it tells you when a move may be running out of room. Peak Exit signals appear when the symbol has reached a point where capturing profits or limiting losses makes sense.
During a strong trade run, you may see several. Each one is an opportunity to manage your position rather than ride it blindly to the end.
ST-1 — Is This Worth Your Attention?
ST-1 answers the question every trader asks when a signal appears:
Is this real, or is it noise?
It measures signal strength as a percentage. Below 20%, and the move may not have enough momentum behind it to be worth acting on. Above 20% and the trade has legs. Well above it and the move may already be mature, meaning you might be late. ST-1 can exceed 100% during exceptionally strong moves.
It doesn't just tell you a signal exists. It tells you whether that signal deserves your focus right now.
ST-2 — Where Is This Going?
ST-2 tracks momentum flow, specifically how far it has moved from zero and in which direction. A cross through zero signals a potential shift, either building in your favor or turning against you.
ST-2 also changes color as momentum builds, giving you a visual read on direction without having to interpret numbers in real time. When the market is moving fast, that visual clarity matters more than you'd expect.
Trend Bars — The Story of the Trade

Trend Bars show you the pattern and strength of a signal as it develops over the course of a trade run. Stronger signals produce heavier, more saturated bars, so you can read conviction at a glance.
They're also interactive. Mousing over any Trend Bar moves the chart to that exact point in the trade, showing you the price action that produced it. The signal panel, the Trend Bars, and the chart all move together. What you do in one affects what you see in the others.
Lollipops and Super Lollipops — Attention Grabbers
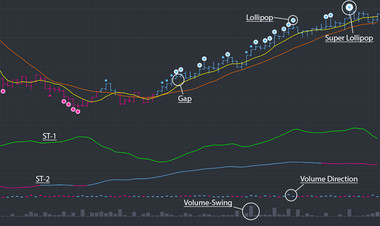
- Lollipops are markers on the chart that flag notable moments. Something significant is happening in the direction the trade is moving. They aren't Peak Exit signals and don't always produce one, but when they appear, they're worth noticing.
- Super Lollipops are larger, more prominent versions of the same idea. When you see one, the market is doing something meaningful. They're designed to be impossible to miss, because missing them has a cost.
The Gap Indicator — Is This the Real Thing?
Not every signal arrives in ideal conditions. The Gap Indicator helps you judge the quality of a move when one appears. It measures how cleanly price is expanding away from prior structure.
- Low readings mean momentum is weak or just developing.
- Mid-range readings mean conditions are healthy and tradable.
- High readings above 75% mean strong expansion and real conviction.
- Negative readings mean momentum is collapsing.
Use it as confirmation. When a signal appears and the Gap Indicator is healthy, you have more reason to act. When it's weak or negative, you have a reason to wait.
Volume-Swing — Who's Actually Winning?
At the bottom of the chart, the Volume-Swing shows you the balance of order flow bar by bar. The bars themselves are a solid light gray. What carries the directional information is the colored cap at the top of each one. A cyan cap means long orders won that bar. Magenta means short won.
Before entering a trade, a quick check of the Volume-Swing cap tells you whether the order flow behind the move matches the direction you're considering. When it does, you have confirmation. When it doesn't, you have a reason to pause. That one check has saved traders from bad entries more times than most would admit.